All posts by Dave Pattern

Borrowing – year on year

Now that we’ve extracted the usage data for 2010/11, we can update some of Huddersfield’s usage graphs from the first phase of the project 🙂

First of all, an update of the graph that shows the average total number of items loaned to honours degree graduates for the last 6 years. As before, for each graduate, we’re looking at the total number of items they borrowed over 3 years (i.e. the graduation year, and the 2 previous years):

graph14

…and updates of the graphs that show borrowing by year of study:

borrowing in year 1 only

borrowing in year 1

borrowing in year 2 only

borrowing in year 2

borrowing in year 3 only

borrowing in year 3

The End is Nigh…

…actually, not quite, but Bryony and I will be giving the last of the scheduled Library Impact Data Project dissemination presentations at Internet Librarian International on October 27th, along with Lisa Charnock and Andy Land, who’ll be talking about the JISC Activity Data SALT Project. The slides and handout are available here: http://eprints.hud.ac.uk/11659/

If you’re attending ILI, be sure to say “hi” to us and hopefully there’ll be time for a drink or two on Thursday evening 🙂

ili2010_008

Release of Project Data

A little later than planned, but we’re pleased to announce that a subset of the data used by the project is now available under an Open Data Commons licence:

http://eprints.hud.ac.uk/11543/

This data set is made available under the Open Data Commons Attribution License http://opendatacommons.org/licenses/by/1.0/

The data contains final grade and library usage figures for 33,074 students studying undergraduate degrees at UK universities.

Background

Each of the 8 project partners provided a set of data, based on the initial data requirements document. Not all partners were able to provide data for e-resource logins and library visits, but all were able to provide library loans data.

In order to ensure anonymity:

1) the 8 partners are not named in the data release, instead they have been allocated a randomly selected name (from LIB1 to LIB8)

2) the names of schools and/or departments at each institution have been replaced with a randomly generated ID

3) the year of graduation has been removed from the data

4) where a course had less than 30 students, the course name has been replaced with a randomly generated ID

5) some course names have been “generalised” in order to remove elements that may identify the institution

Grades

The awarded degree has been mapped to the following code:

A = first (1)
B = upper second (2:1)
C = lower second (2:2)
D = third (3)
E = pass without honours

Library Usage

Where supplied by the project partner, the following library usage data measures are included:

ISSUES = total number of items borrowed from the library by that student (n.b. this may include renewals)
ERES = a measure of e-resource/database usage, e.g. total number of logins to MetaLib or Athens by that student
VISITS = total number of times that student visited the library

Other Notes

1) each graduate has been allocated an randomly generated unique ID

2) where the course/school/department name was not supplied, it has been replaced with N/A

3) where the measure of library usage was not supplied by the partner, the value is blank/empty

Huddersfield — borrowing year on year

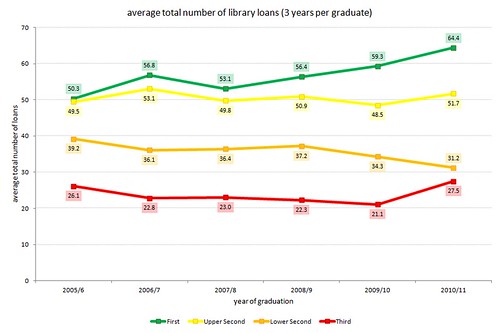
If you’ve seen Graham or myself presenting recently about the LIDP, you’ve probably seen this graph (described here)…

The graph shows 5 years of graduating students (2005/6 thru to 2009/10, with approx 3,000 graduates per year) and the average number of books they borrowed. So, “2005/6” shows the average number of books borrowed by the 2005/6 graduates

Quite early on during our data analysis, I noticed that the correlation in book borrowing seemed to be there from day one for students — in other words, students who eventually get the highest grades borrow more in their first year of study than those who eventually get lower grades.

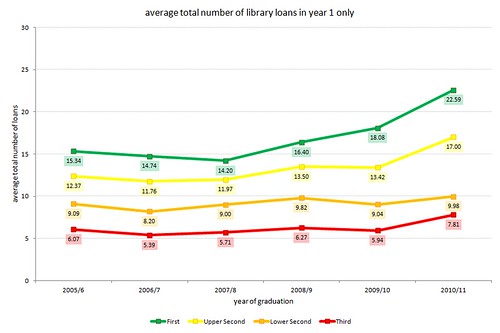
So, here’s a year by year breakdown of the above graph, where “year 3” is the year the student graduated in…

borrowing in year one only

I’m actually quite surprised how clear the gaps are between each grade, even though we’re not talking about large numbers of loans.

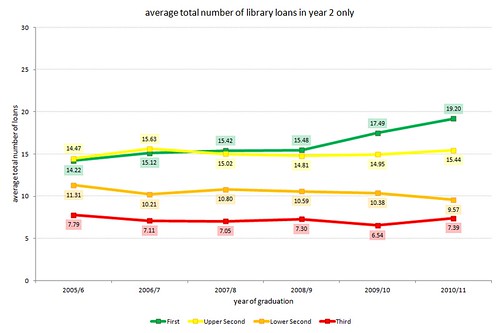
borrowing in year two only

The borrowing by students who go on to get a first is fairly similar in the second year, as is the borrowing by those who’ll get a third. However, the borrowing by 2:1 students increases to a similar level to firsts (although you can see in 2009/10, second year borrowing by the firsts is breaking away).

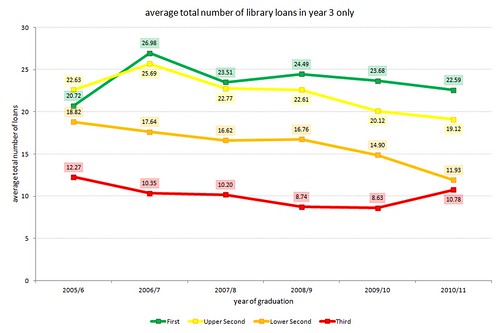
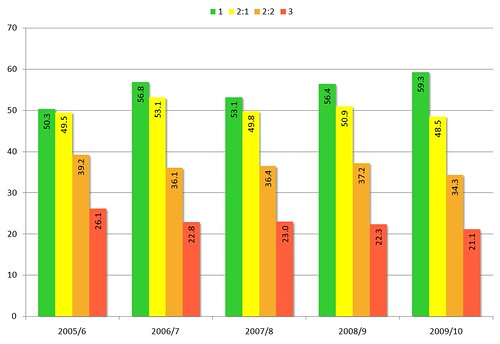
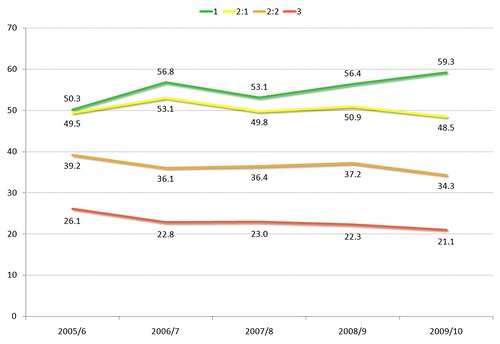
borrowing in year three only

In the final year of studies, we see a marked increase in borrowing (no surprises there!). As with the original graph, we can see that 2:2s and thirds are showing a declining trend in borrowing.

In many of the data sets we’ve looked at in this project, we’ve seen similar(ish) borrowing levels for firsts and 2:1s. At most, in 2009/10, the gap in average borrowing is only 4 books. However, it does look like borrowing by 2:1s in their final year of study is also showing a declining trend.

Data analysis update

Whilst we wait for all of the data from the project partners to arrive, Bryony and I have done a quick & dirty analysis of the data we’ve received so far.

The good news (touch wood!) is that we’re still on track to prove the project hypothesis:

“There is a statistically significant correlation across a number of universities between library activity data and student attainment”

The data we’ve looked at so far has a small Pearson correlation (in the region of -0.2) that has a high statistical significance (with a p-value of below 0.01).

The reason we’re seeing a negative correlation is due to the values we’ve assigned to the degree results (1=first, 2=upper second, 3=lower second, 4=third, etc).

We suspect one of the reasons for the small Pearson correlation is the level of non & low usage (which is something we’ve looked at previously in Huddersfield’s data). Within each degree level, there are sizeable minorities of students who either never made use of a library service (e.g. they never borrowed any books) or who only made low use (e.g. they borrowed less than 5 books), and it’s this which seems partly responsible for lowering the Pearson correlation. However, the data shows that:

  • students who gained a first are less likely to be in that set of non & low users than those who gained a lower grade
  • students who gained the highest grades are more likely to be in the set of high library usage than those who gained lower grades

5 years of book loans and grades at Huddersfield

I’m just starting to pull our data out for the JISC Library Impact Data Project and I thought it might be interesting to look at 5 years of grades and book loans. Unfortunately, our e-resource usage data and our library visits data only goes back as far as 2005, but our book loan data goes back to the mid 1990s, so we can look at a full 3 years of loans for each graduating students.

The following graph shows the average number of books borrowed by undergrad students who graduated with an specific honour (1, 2:1, 2:2 or 3) in that particular academic year…

books

…and, to try and tease out any trends, here’s a line graph version….

books2

Just a couple of general comments:

  • the usage & grade correlation (see original blog post) for books seems to be fairly consistent over the last 5 years, although there is a widening between usage by the lowest & highest grades
  • the usage by 2:2 and 3 students seems to be in gradual decline, whilst usage by those who gain the highest grade (1) seems to on the increase