Now that we’ve extracted the usage data for 2010/11, we can update some of Huddersfield’s usage graphs from the first phase of the project 🙂
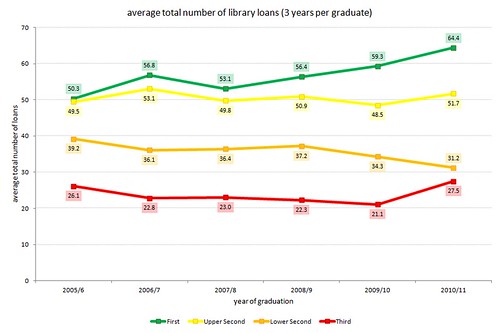
First of all, an update of the graph that shows the average total number of items loaned to honours degree graduates for the last 6 years. As before, for each graduate, we’re looking at the total number of items they borrowed over 3 years (i.e. the graduation year, and the 2 previous years):
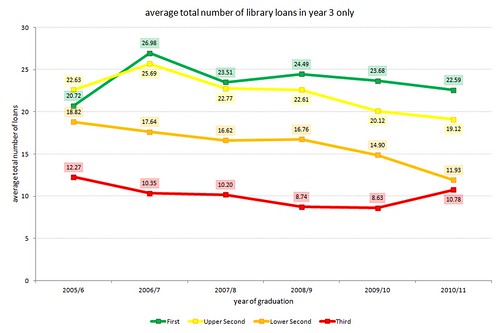
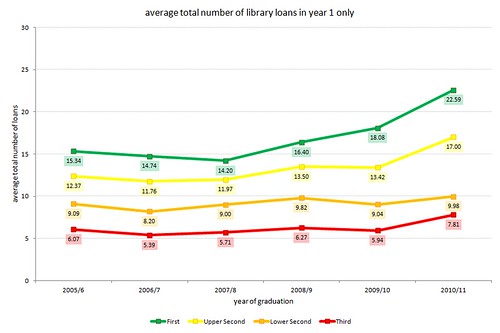
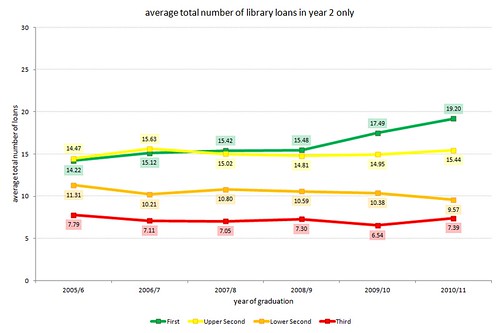
…and updates of the graphs that show borrowing by year of study:
borrowing in year 1 only
borrowing in year 2 only
borrowing in year 3 only